I am a December 2020 Graduate student at Rutgers University pursuing a Master's degree in Information Technology & Analytics. My Commendable Skills are in R, Python, SQL, Excel, Tableau, Statistics and Data Analytics. My passion for Data Analytics has given me a boost to complete two internships in a Data Science related field and passionately work on almost 6 projects where I used various Softwares and enhance my analytics skills.
I am looking for a perfect Full time opportunity to use my technical knowledge in real world data which will directly affect the companies performance, which will be very motivating for me to work on and achieve my professional goals.
Statistical analysis & the know-how of leveraging power of computing frameworks to mine-process and present the value out of unstructured bulk of data is the most important technical skill I have acquired for my passion to become a data scientist.
Development is important in Data Science, I have completed my internship as a Data Analyst Intern this summer. I strongly believe that Development , Stats and Analysis are three main pillars of Data Science.
Whats the use of analyzing millions of rows of data if one can't visualize it. Tableau and Power BI are the best tools to tell a story from any given data. I'm also able to present complex results to a non-technical audience.
Built Strategic data and reporting capabilities for J&J’s global Technology Services organization, including Tableau dashboards and datasets in Cloudera Data Lake environment. Developed dashboards for IT operations reporting, strategic supplier management, technology lifecycle, Scrum & Agile processes, finance, project management and other key domain areas across the organization. Utilized Agile development methods and Design Thinking principles to prioritize work, obtain requirements and build dashboards and reports. Drove increase in users from approximately 300 regular users to over 1200 by following a product-focused approach to team’s data assets
Advocated in creating Tableau Dashboard used for university Enrollment, Retention and Graduation (ERG) Analysis. Extracted, transformed, and loaded data on more than 6,500 students enrolled in Rutgers education programs. Employed MS Excel for maintaining, analyzing student’s information and summarized each semester results
Streamlined daily sales data of the company; managed daily, weekly, monthly data analysis statement and data process monitoring. Delegated and maintained database of 3GB at a fixed period and analyzed existing client data to supply the foundation for marketing decision. Monitored and pre-processed 10 years of client data using SQL and utilized regression models to analyze factors. Integrated trend analysis and graphic representation of each product using 5 + Tableau dashboards
Will Animated (CGI) based movies ever replace reality movies? Visualized data of past 30 years of movies on Tableau, performed EDA, built 5 dashboards Predicted if Animation genre movies will be dominating real-life films in 15 years
Predict Stock price of Microsoft.
What makes a Youtube video go on its trending page? Are there any specific parameters such as upload day, time or anything else which would help the video go trending? Lets find out:
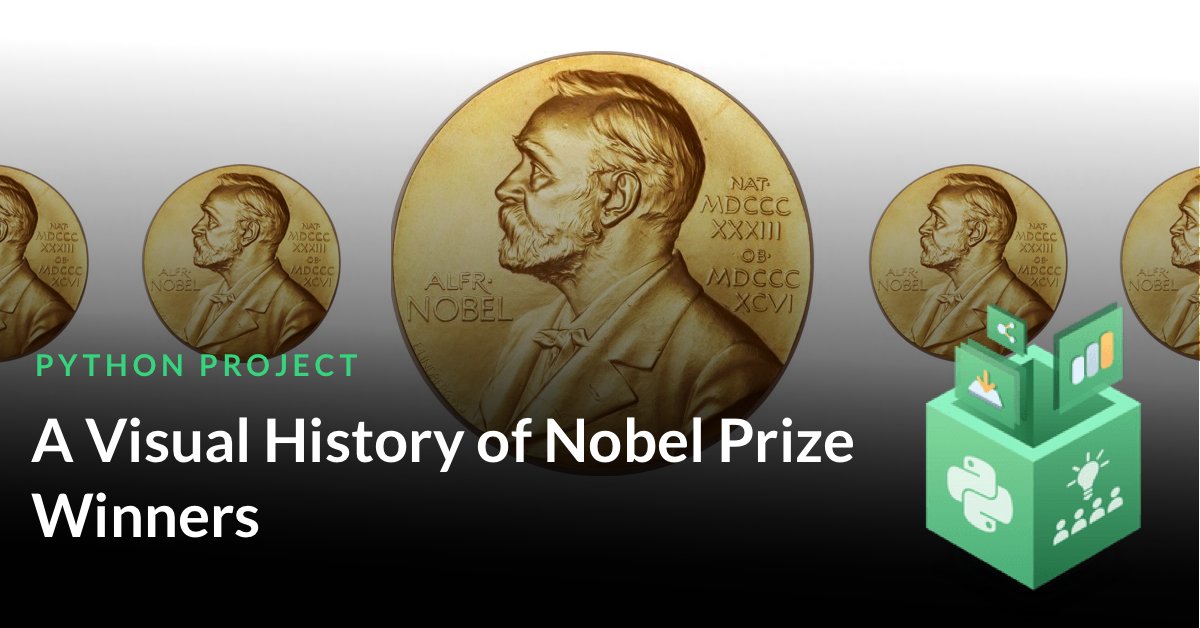
The Nobel Prize is perhaps the world's most well known scientific award. Let's visualize the data of nobel prize winners of past 100 years. I have used the following:
After exploring a Dataset containing game info and cleaning our data a little, we're going to answer questions like: